Website performance: How site speed affects UX

Fast websites build trust
Website performance, or how quickly your website loads, can be easy to overlook in the design process. But performance is a foundational aspect of the user’s experience — it’s literally the first thing they see (or don’t see) when they visit your site.
Fast websites build trust
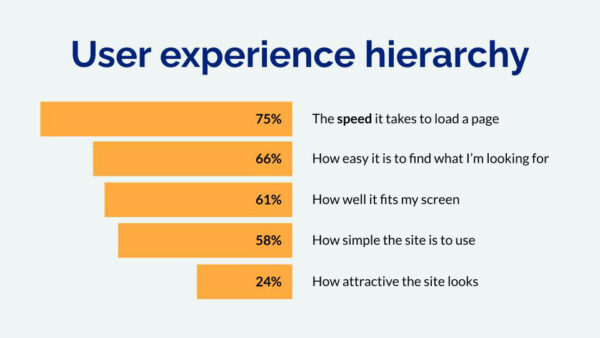
A study by Google showed that among the factors that contribute to a smooth website experience, users ranked page load speed as number one.
3 seconds to load
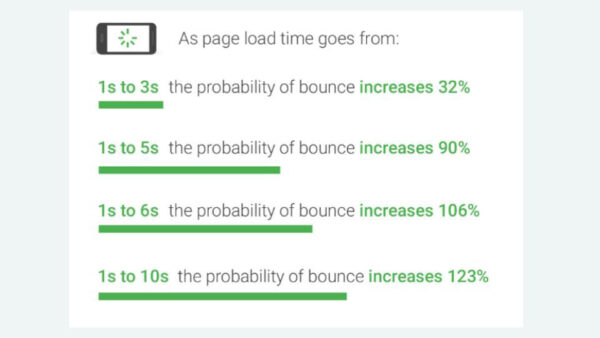
And it only takes a few seconds to erode a user’s experience. Research shows that 3.7 seconds is the proverbial cliff of frustration — meaning, when a page takes more than 3 seconds to load, the chance that users will get annoyed and give up multiplies by three.
How to test site speed
In reality, a lot of websites take longer than 3.7 seconds to load. But it’s a good number to keep in mind, considering that your website is an opportunity to build trust with the people you serve. If someone feels frustrated by your website, there’s a good chance they’ll feel frustrated with your brand or organization in general. Not a good look — and worth preventing if possible.
How to test site speed
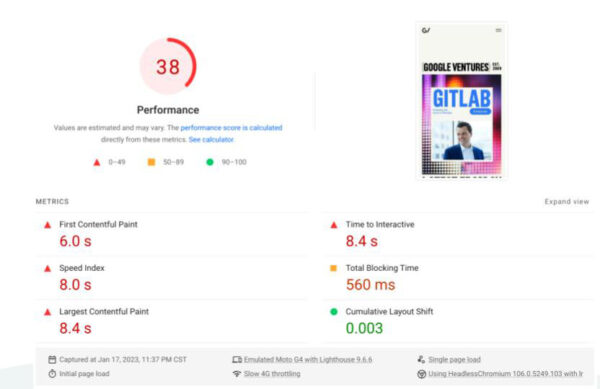
PageSpeed Insights by Google is a great tool for developers and non-developers alike. Enter your URL to run a quick test and get a report on your site’s performance health.
Reading the report
All the numbers contribute to the overall score, but these are the most digestible if you’re new to site performance:
- First contentful paint – the time it takes for any content on the page to load
- Largest contentful paint – the time it takes for most of the page the load
- Time to interactive – the time it takes before users can perform an action, such as searching or filling out a form. (If users just need to read content, the first contentful paint score is a better indicator for this.)
If any scores are in the red or yellow, you have opportunities to improve. At Pixo, we frequently use the performance report to help us prioritize improvements, whether we’re designing a new site or doing ongoing maintenance.
How to improve performance
One of the nice things about PageSpeed Insights reports is they include platform-specific recommendations alongside the list of opportunities — for example, installing a certain plug-in if you have a WordPress site. But there are some common things that routinely slow sites down and likely need attention.
An example of some easy ones are:
- Properly size images
- Use a better image format (to make the file size even smaller yet)
- Designate explicit width and height for image elements
Then you get into some more technical tasks like:
- Enable HTTP/2
- Enable file compression
- Serve static assets with an efficient cache policy
- Minimize main-thread work
Performance is never really done; the goal is to get better over time. Any little bit you can do to reduce your page load — even by fractions of a second — is worth it for your users.
Need web development expertise?
Get in touch. Our development team can help you make improvements now and plan for a faster, more user-friendly site in the future.